
Jasper Reports is the world's most popular open-source reporting tool. Written in Java, the tool enables you to use data coming from any kind of data source and produce Pixel Perfect documents that can be viewed printed, or exported in a variety of document formats including PDF, HTML, Excel, open office, and RTF.
In this blog post, you will be provided step-by-step instructions on creating a local environment on your own PC and using Tibco Jasper Studio 6.20 for designing your reports.

These are the five prerequisites for this exercise. If you do not already have these five software set up on your PC then go through this BLOG POST OR watch this Video and create the local environment first.

In this tutorial, we are going to create this customer invoice report.

For this, we will be using four database tables. If you want to follow along, then click this LINK to watch the video to create these tables prior to proceeding with this tutorial. We will be using these tables prefixed with the demo.

Now, let's get started with the Jasper report integration. First, you have to download a piece of software called the Jasper Reports Integration Kit. The download link for this kit is provided in the following screenshot, as well as by clicking this Github site Link. Jasper Reports Integration provides an interface to use the Jasper Reports reporting engine in an Oracle database application, specifically with Oracle Apex.

Go to the GitHub site and download the ZIP file highlighted in the screenshot below.

Now execute these steps to install the j2ee application and configure the data sources. j2ee stands for Java 2 Platform Enterprise Edition. The j2ee application has to find various configuration files application.properties and log4j2.xml files in the configuration folder and also the reports that we can run in the reports folder.
For example, test.jasper is a report that we will use to test this installation. Create a folder named app and then create a subfolder named Jasper Reports Integration, under the app folder. If you already have the app folder, then just create the Jasper Reports Integration subfolder.

Copy the downloaded Jasper Reports Integration kit zip file to the subfolder, and extract it. These are the folders that are extracted from the zip file. If you don't see the logs folder create it.

Next set the configuration directory directly in the jri.war file using a command. Open a command prompt, switch to the bin folder under the Jasper Reports Integration subfolder, and execute this command (setConfigDir.cmd ..\webapp\jri.war c:\app\JasperReportsIntegration) [highlighted in blue color below].

Execute this command (getConfigDir.cmd ..\webapp\jri.war) [highlighted in blue color below], on the same bin prompt to determine the configuration directory.

In the following steps, you will configure your database access. Switch to the configuration folder in the Jasper reports Integration subfolder. Edit the file named application type properties file.

Configure the data source default to connect to your Oracle schema.

Now deploy the j2ee application by copying the file jri.war from Jasper reports integration web app directory to the Tomcat web apps directory.

Open the services interface. Stop and then restart Tomcat services. Apache Tomcat was installed in this Video.

Open your browser and enter this (http://localhost:8888/jri) URL to access the Jasper reports integration homepage. First test the basic connectivity test, then the basic report test.

A report will pop up named Integration Test, in the form of a pdf. This test report is called from the reports folder, under the JasperReportsIntegration subfolder. You have to place all the reports (highlighted in green color) with the Jasper extension in the reports folder.

Open a command prompt, and switch to the SQL folder in the Jasper reports integration subfolder. Connect SQL plus as sys dba (highlighted in blue color). Set the container using the command (in green color). Run the installation script (in red color) and pass the name of the target application schema as a parameter.

If you are installing on an Oracle release 11.0 and higher, you have to Grant the required Network privileges to the application schema. Since we have Oracle 21c we will execute the script (in red color). Press the enter key to continue.

Exit SQL Plus. On the SQL subfolder prompt, change encoding to Unicode for the SQL files using the set command (highlighted in blue color). Connect as the application schema (in green color). Run the database installation script (in yellow color).

Now download and install Jaspersoft Studio, with Jaspersoft Studio you can build documents of any complexity from your data from print-ready PDFs to interactive masterpieces in Dynamic HTML. For this exercise, we downloaded and installed version 6.20.1 of Jasper Studio (highlighted in red color).

After downloading, launch the executable file and follow the on-screen instructions to install Jasper Studio.

After configuring the local environment you are ready to create reports in Jasper Studio. These are the three steps involved in creating Jasper reports and integrating them with Oracle Apex.

let's create a connection to the data source. Launch Jasper Studio. In Jasper Studio create a new data adapter (by clicking the file menu under the new option). The first screen of the data adapter wizard will appear. On this screen, you will see a folder named my reports. This is the folder where the data adapter file and reports will be stored and this folder is usually created in the users folder. The data adapter file contains jdbc data adapter class name driver username password and other connection information. Enter a name for the data adapter file.

On the second wizard screen, select Database JDBC Connection.

On the Database JDBC Connection page, enter a suitable name for the connection (marked in red color). Select Oracle jdbc driver from the JDBC Driver list (marked in blue color). Then enter JDBC Url which points to your local pluggable database and port (marked in green color). Enter your database schema and password (marked in yellow color). Click the Driver Classpath tab (marked in orange color).

On the Data Adaptor screen, Click the Add button. In the open dialog box, go to the directory (marked in red color) and select the ojdbc8 file. On the Database JDBC Connection wizard page, click the test button (in green color at the bottom). If everything is okay you will see a dialog box displaying Successful, click OK and then finish (in yellow color) to complete this process.

After establishing the connection with the database. let's create a report in Jasper Studio. Create a new Jasper Report (by clicking the file menu under the new option). On the report templates wizard screen, select the blank A4 option. Enter invoice.jr xml for the File name. Click the Next > button (Not Finish). On the data source screen, select the SCM data adapter you created for this exercise from the data adapter list.

Scroll down you will see SCM (Current). This SCM (Current) [marked in green color] is the schema you are currently connected with. Enter this SQL query on the texts tab. This query will fetch data from the SCM schema for the invoice report. Click the Next > button (Not Finish).
SELECT m."ORDER_ID" inv_id,
	m."ORDER_TIMESTAMP" inv_date,
	m."USER_NAME" inv_user,
	c.cust_first_name || ' ' || c.cust_last_name customer,
	c.cust_street_address1 || ' ' || c.cust_street_address2 address,
	c."CUST_CITY" city,
	c."CUST_POSTAL_CODE" pcode,
	p."PRODUCT_NAME" product,
	d."UNIT_PRICE" price,
	d."QUANTITY" quantity,
	d.unit_price * d.quantity amount
FROM "DEMO_ORDERS" m,
	"DEMO_CUSTOMERS" c,
	"DEMO_ORDER_ITEMS" d,
	"DEMO_PRODUCT_INFO" p
WHERE
	 m."ORDER_ID" = d."ORDER_ID"
	 AND d."PRODUCT_ID" = p."PRODUCT_ID"
	 AND m."CUSTOMER_ID" = c."CUSTOMER_ID"
ORDER BY m."ORDER_ID" DESC

Select all the fields (from the left pane to the right pane) to include them in the invoice report. Click the Next > button (Not Finish).

Skip the group by screen (by clicking the Next> button) and click Finish to complete the report creation process. This is the report design interface. Click the DataSet and Query editor dialog icon.

Double-click this Oracle SQL time stamp entry under Class Type and change it to Java SQL timestamp using the drop-down list (marked In Orange color). While executing this step make sure that the SCM data adapter is selected (In red arrow).

In the main report design area, click the title band and press the delete button on your keyboard to remove this band from the report. Repeat this action to remove column header, column footer, and summary bands, because our report doesn't need these bands.

Now right-click the root invoice report node and select create group from the context menu [In green color]. In the group dialog box, enter the invoice ID for the group name [In orange color]. Select the create group from a report object option [In red color]. Select the invoice ID column in the report objects columns list and click finish [In yellow color].

Two new header and footer bands will be added to the design area. The final look of the design area should be like this.

Click the invoice ID group header band in the design area. Place a checkmark on the start new page property in the properties pane. Do the same for the invoice ID group footer band. This check will ensure that each invoice will print on a new page.

After this, delete the group Header by selecting it in the design area (In red color) and pressing the delete button on your keyboard. The band is removed because this band will not contain any object. Do not delete the group footer band.

Note that when you delete a band, It vanishes from the design area, but it exists in the outline Pane and you can restore it if needed using this add header band option (In yellow color).

From the outline pane to your left, expand the fields node. Drag and drop the Invoice ID column, to the page header section in the design area under the main report (In red color). In the text field wizard dialog, select the no calculation function and click finish (In green color).

The field will be added to the page header section under the main report. Repeat this step to place the invoice date, customer, address, city, and postal code fields in the page header section under the main report (In red color). In the text field wizard dialog, select the same (no calculation function) option.

Now place the product field in the detail 1 band. When you drop a field in the detail 1 band, the corresponding heading of the field is also dropped there. Move the corresponding heading of the product field (from the detail 1 band) to the page header section (under the main report). Repeat this process for the price, quantity, and amount fields. First, pick the field from the outline pane, and drop it into the detail 1 band (In yellow color), then move the corresponding headings of these fields, from the detail 1 band to the page header (In red color).

Align the top edges of the four fields (in the detail 1 band).

To add invoice totals, drag and drop the quantity field (from the outline pane) to the invoice ID group footer 1 band (under the main report). For calculation type, select the sum function and click finish. Repeat this step to display the sum for the amount field as well.

In the outline pane, right-click the parameters node and select Create parameter from the context menu. A new parameter, parameter 1 will be added in the properties pane. Enter FROMDATE for the parameter name (in red color). Repeat this step to add three more parameters named TODATE, FROMNUMBER, and TONUMBER. These parameters will allow you to print specific invoices created on specific dates. Arrange the parameters in order (arranged in blue color).

Click the data set and query editor dialog icon and add these additional conditions (in yellow color) in the existing where Clause to incorporate the four parameters (FROMDATE, TODATE, FROMNO, and TONO).
AND m.order_timestamp between to_date($P{FROMDATE},'DD-MM-YYYY') and to_date($P{TODATE}, 'DD-MM-YYYY')
	AND m.order_id between $P{FROMNO} and $P{TONO}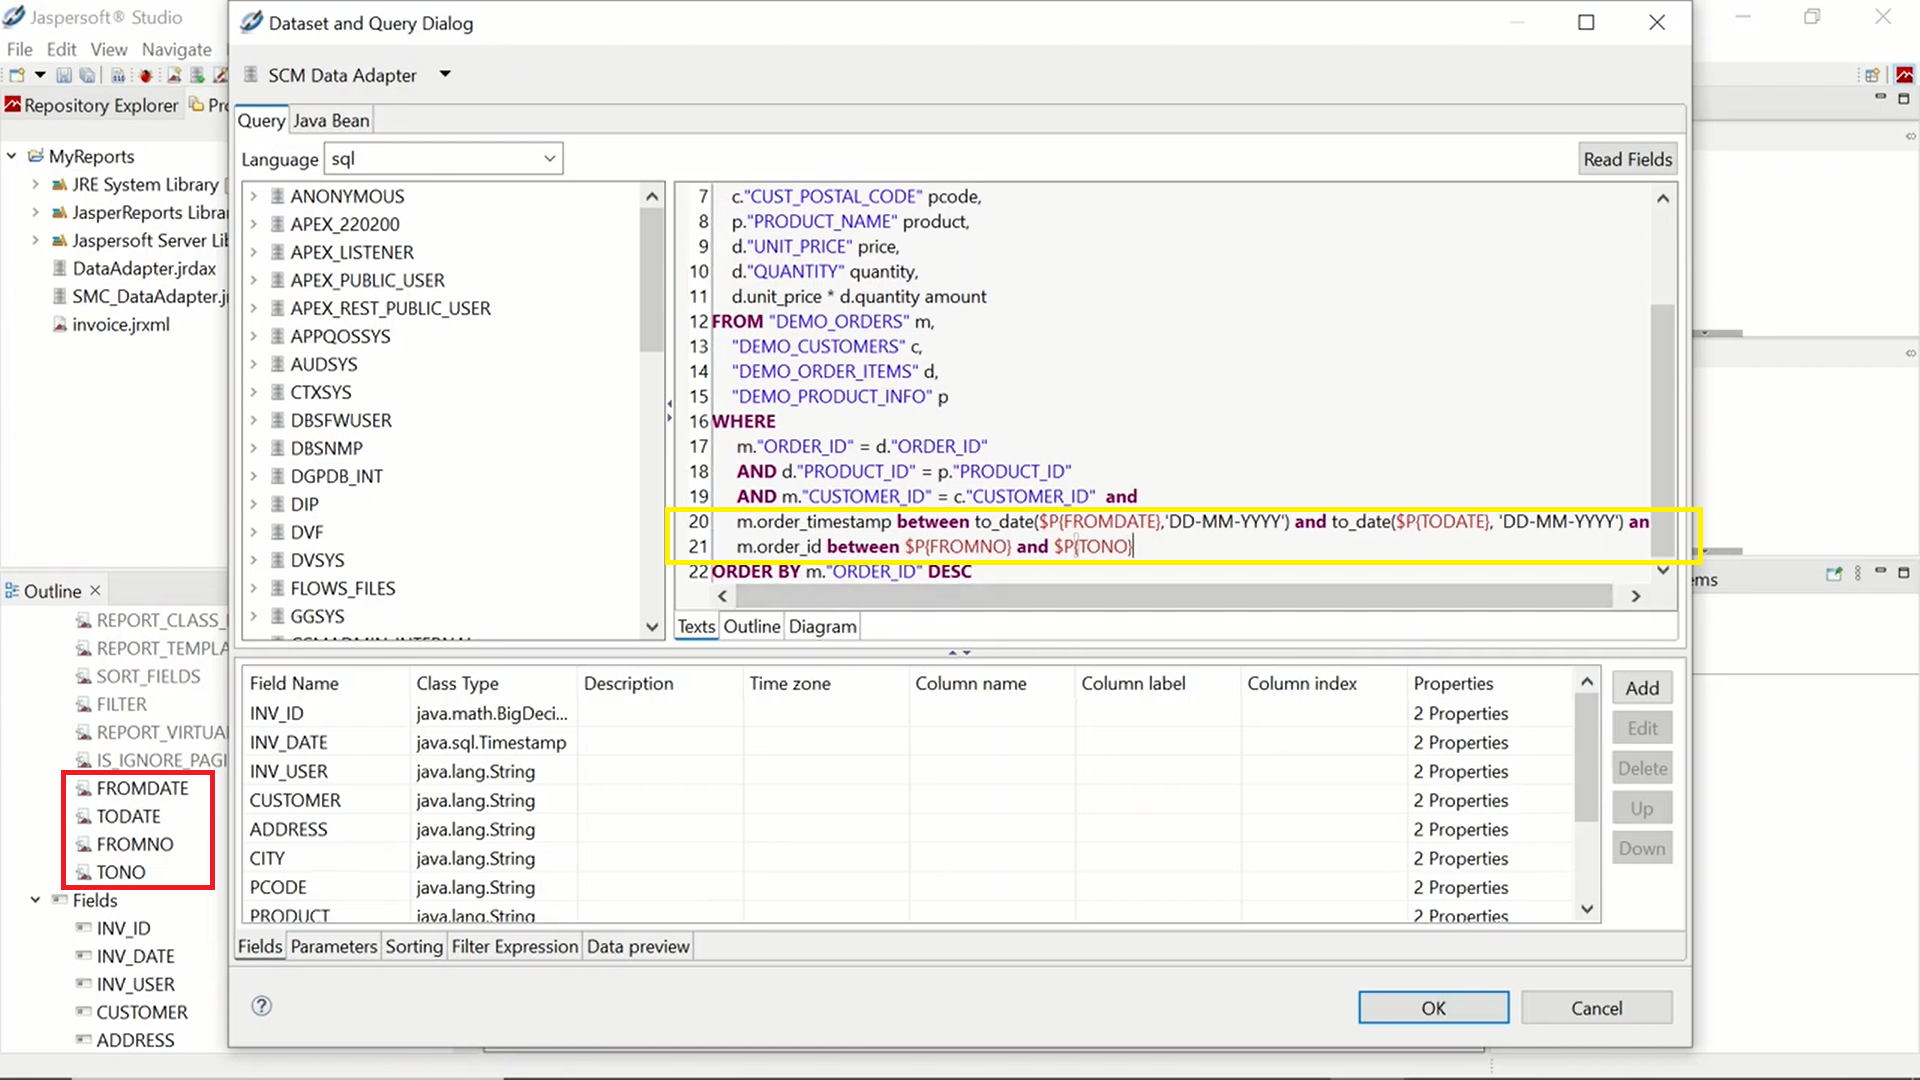
Click the preview tab (in blue color). Enter dates and invoice numbers in the input parameters dialog box (in orange color). Click the Run button (in red color) to see the invoice report in action.

Click the save icon or press Ctrl+S to save your report. We adorned the report with some cosmetic work (in the screenshot below) using the tools provided in the right pane.

All the headings are created using the static text tool (In red color). Fonts and alignments are applied using the ribbon and properties in the property pane (In orange colors).

This line (in red arrow) is added using the line tool (in Basic Element [Palette]). The back color property (in yellow color) is used to apply this blue background color to the static text items in the report.

Apply the format to the date of invoice field using the pattern property.

Apply a thousand separator to the amount field (using the same pattern property).

Switch back to the design view. Click the compile report icon (in red color). A compiled version of the report named invoice.jasper (in orange color) will be created in the folder where the actual report file invoice.jrxml is saved.

The report is ready to be integrated with Oracle Apex. So close Jasper studio and execute the instructions provided in the next section. After creating and compiling your report in Jasper Studio your next move is to place the compiled version of the report file to an appropriate location and integrate it in your Apex application. Copy & Paste the compiled report invoice.jasper (in red color) to the Tomcat server (in green color).

Sign in to your Apex workspace. I created this invoice page (number 2) to print invoices using the invoice report. Add four-page items to the page (in red color) to receive values for the report parameters. The FROMDATE and TODATE page items are of the date picker type. They will receive the date in the format (in blue color).

The FROMNO and TONO page items (in red color) are of text field type and these items will receive a range of invoice numbers. The button (in yellow color) will be used to submit the print request.

In the processing tab, this process (in red color) will connect your Jasper server and pass report parameters. Copy & Paste this code below in PL/SQL Code section (in orange color).
declare
  l_additional_parameters varchar2(32767);
begin
  xlib_jasperreports.set_report_url('http://localhost:8888/jri/report');

--  Merge parameters in l_additional_parameters variable
  l_additional_parameters := 'FROMDATE=' || apex_util.url_encode(:P2_FROMDATE);
  l_additional_parameters := l_additional_parameters || '&TODATE=' || apex_util.url_encode(:P2_TODATE);
  l_additional_parameters := l_additional_parameters || '&FROMNO=' || apex_util.url_encode(:P2_FROMNO);
  l_additional_parameters := l_additional_parameters || '&TONO=' || apex_util.url_encode(:P2_TONO);

  xlib_jasperreports.show_report (p_rep_name => 'invoice',
                                  p_rep_format => 'pdf',
                                  p_data_source => 'default',
                                  p_rep_locale => 'en-US',
                                  p_out_filename => 'invoice.PDF',
                                  p_additional_params => l_additional_parameters);
  apex_application.g_unrecoverable_error := true;
end;
Everything is set, Now run the page to test your work. If you encounter this Json error (in yellow color), then switch back to the design area.

Click the root node of the page (in red color), in the properties pane scroll down to the advanced section, and set the reload on submit property to always (in blue color).

Click save and reload the page. Click the PDF Button at runtime. And there you are with the invoice report appearing on your screen.


