
An excerpt from the book Create Rapid Web Applications Using Oracle Application Express - Second Edition
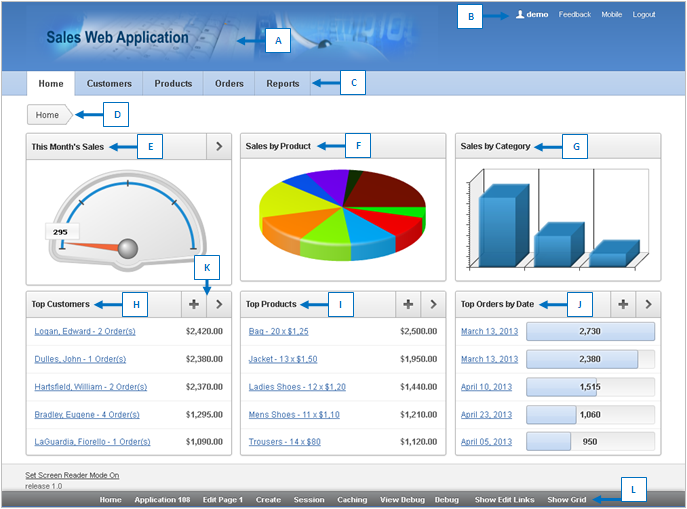

A: Application Logo
B: Navigation Bar
C: Tabs
D: Breadcrumb
E-J: Regions
K: Button
L: Developers Toolbar
The Home page contains six regions (E-J):
- This Month’s Sales
- Sales by Product
- Sales by Category
- Top Customers
- Top Products
- Top Orders by Date
This Month’ Sales demonstrates the use of a Flash Dial chart. This chart displays a value based on an underlying SQL statement to graphically present current month’s sales.
Sales by Product is a pie chart that shows sales share of each product in color-coded slices.
Sales by Category is a bar chart to present sale figures of the three categories setup in the database.
Top Customers is a report based on a SQL query and displays a subset of the information that appears on the Customers page. Users can link to additional details by clicking the customer name or by clicking the View Customer button (marked as K in the above figure) in the upper right corner of the region. The button with the plus sign is used to create a new customer.
Top Products is also a report based on a SQL query. This report displays a subset of the information that displays on the Products page. Users can link to product details by clicking the product name or by clicking the View Products icon in the upper right corner of the region and can even create a new product using the Add Product button.
Top Orders by Date displays top orders by date and order amount. Clicking the right arrow button takes users to the main orders page while the first one allows them to create a new order. Continue >>>


